
SECTION 6.1PROBABILITIES WITH TREEDIAGRAMS AND TABLES
© Copyright all rights reserved to Homework depot: www.BCMath.ca
WHAT IS PROBABILITY?
Probability - the likelihood or chance that an event willoccur, ranging from zero to one (100%)
A probability of zero means that it will never occur
A probability of one or 100% means that it must occur
A probability of 0.5 means that it has a 50% of happening
Can’t have a negative probability or anything greater than one
Formula for calculating Probability
P(A) – the probability that event “A” will occur
© Copyright all rights reserved to Homework depot: www.BCMath.ca


WHAT IS A SAMPLE SPACE?
A sample space is a list of all the possible outcomes from anexperiment
Ex: Find the sample space for each of the following experiments:
i)Flip a coin
i)Roll a dice
i)Picking a card from a deck
i)A letter is chosen from the word:CHICAGO BULLS
© Copyright all rights reserved to Homework depot: www.BCMath.ca
PROBABILITY WITH TREE DIAGRAMS:
A tree diagram can be used to illustrate all the ways anexperiment can be occur
Each branch is a particular outcome
For instance, when we flip a coin the outcomes can beillustrated as:
Now suppose we flip two coins, the tree diagram will be:
1 Coin:
Heads
Tails
2 Coins
Heads
Tails
Heads
Tails
Heads
Tails
There are two cases
heads or tails
There are four cases heads or tails
HH, HT, TH, and TT
Practice: Suppose you flip a coin and then roll a die. Drawa tree diagram to illustrate this experiment:
b) Suppose you roll a die. If it is even, you flip a coin. If itis odd, you roll the die again. Draw a tree diagram:
1st Coin:
Heads
Tails
1
2
3
4
5
6
1
2
3
4
5
6
There are 12 cases altogether
H1, H2, H3, H4, H5, and H6
T1, T2, T3, T4, T5, and T6
1st Die
2,4, 6
1, 3, 5
Heads
Tails
1
2
3
4
5
6
There are 24 cases altogether
2H, 2T, 4H, 4T, 6H, 6T
1: 1 to 6, 3: 1 to 6, 5: 1 to 6
© Copyright all rights reserved to Homework depot: www.BCMath.ca
ROLLING DICES:
Game: Roll two dice and take the sum. Your choiceswill be numbers from 2 to 12. Which sum will beappear the most?
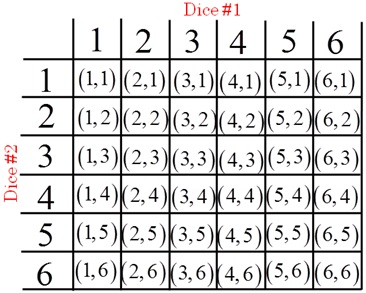
When dealing with dice problems, it’s best to make adice chart:
Dice #1
Dice #2
There are 36 different
Outcomes!
The dice chart can be used tofind out which outcomeswould appear the most andwhich ones will be the least
© Copyright all rights reserved to Homework depot: www.BCMath.ca
Practice: Find the probability of rolling two dice andgetting each sum in the brackets:
You can’tget a sumof zero!!


Luckyseven!
© Copyright all rights reserved to Homework depot: www.BCMath.ca